5.15.2016 ― Package Control: posters from default R-packages
A consequence from a library visit
Background
It was a promising Saturday: I was giving a small hands-on workshop about R in a local library. We were trying to work out on social media platforms and try to solve issues when transferring your connections between two social networking services. Since our session was longer than expected and library opening-hours, the security guy rather felt we were becoming an issue between two services: the library and the outdoor.
Yet, we got mercy – the lobby was more than suitable place to finish the workshop. While gathering my stuff from the working space, I noticed 'free stuff' self, containing tens of computer magazines. In that impulsive nanosecond, the amount of my stuff just doubled. Wobbling happily – but heavily – away I wasn't aware of I had just picked an awesome gem...
This is my adaptation from Column-grid poster design made neat and easy tutorial from Computer Arts issue 205 by Mark Bloom – aka Mash Creative. This is an Illustrator execution for visualizing R 3.0.1. version's default packages.
Name it
There is a lot of symbolism with names and naming related to R. The usage of name 'R' is alphabetical play from the predecessor and first authors [1]. Since R is based on S-language and could be considered as the next level from it, it is kind of nice symbol to take the next letter from S – literally to left. Having two first authors as Robert and Ross, having the first initials R was another reason to get serious with the current name. With all this history behind naming the language, there are limited options for the future: an updated to-be-invented version of R-language must be named Q and it should be created by authors having initials with Q. This straightforward conclusion must limit the R development a lot: programming collaboration between royal Queens and Q from James Bond seems bit unlikely...
When it comes to naming the packages in R, we are entering to the Wild West show. In this example I had as sample the default packages from R version 3.0.1. that is 30 units. From those 26 are (1) in totally written with lower cases. Then we have few cases that seem to be concatenated words, (2) using upper cases to highlighting the seam; packages that (3) has a upper case initial and the ones that are the combinations from both of these styles. Of course, exceptions strengthens the rules and therefore we have (4) WHAT-YOU-MEAN-IM-SHOUTING-WITH-USING-ONLY-CAPITALS example package 'MASS'. This anarchy and chaos in naming is not just with packaging, but found also in general within R-language [2].
But R versions are like having multiple children – giving them names adds more characteristics to them than using only birth order to refer them. Even I was unable to scout the official reference or verification, the R versions seem to be named by the comic Peanuts by Charles M. Schulz. Searching any R version with the keyword 'Peanuts' should provide an entertaining result from cartoon section. Apparently the version 3.0.1.'Good Sport' is related to our dear fellow Charlie Brown, a pumpkin helmet, an escape from a vet and winning against all odds [3]. Sounds just like a normal day in the office...Still one thing the R-project providers did not probably consider while taking Peanuts to be part of version control, was the idiom: Give peanuts, get monkeys. Since R is a good quality piece itself, this idiom might rather explain both naming convention anarchy and also my personal fooling around R.
Open-source, open for all!
I might have put the sub title bit boldly, but I do agree with this one. Whereas there do are great amount and quality of statistical tools available, they are rather designed for serious business. That is they might be having good performance, nice product family and a price tag reflecting those. But being a normal fellow, keen on data hacking or likewise, it is probably not that relevant investing actual money to a hobby or an interest. If there wouldn't be any free open-source tools, access to knowledge would be only in the hands of those-who-have. It is therefore delightful, that currently anyone can download programs such R and get started with data mining / statistics / random name conventions.
Execution
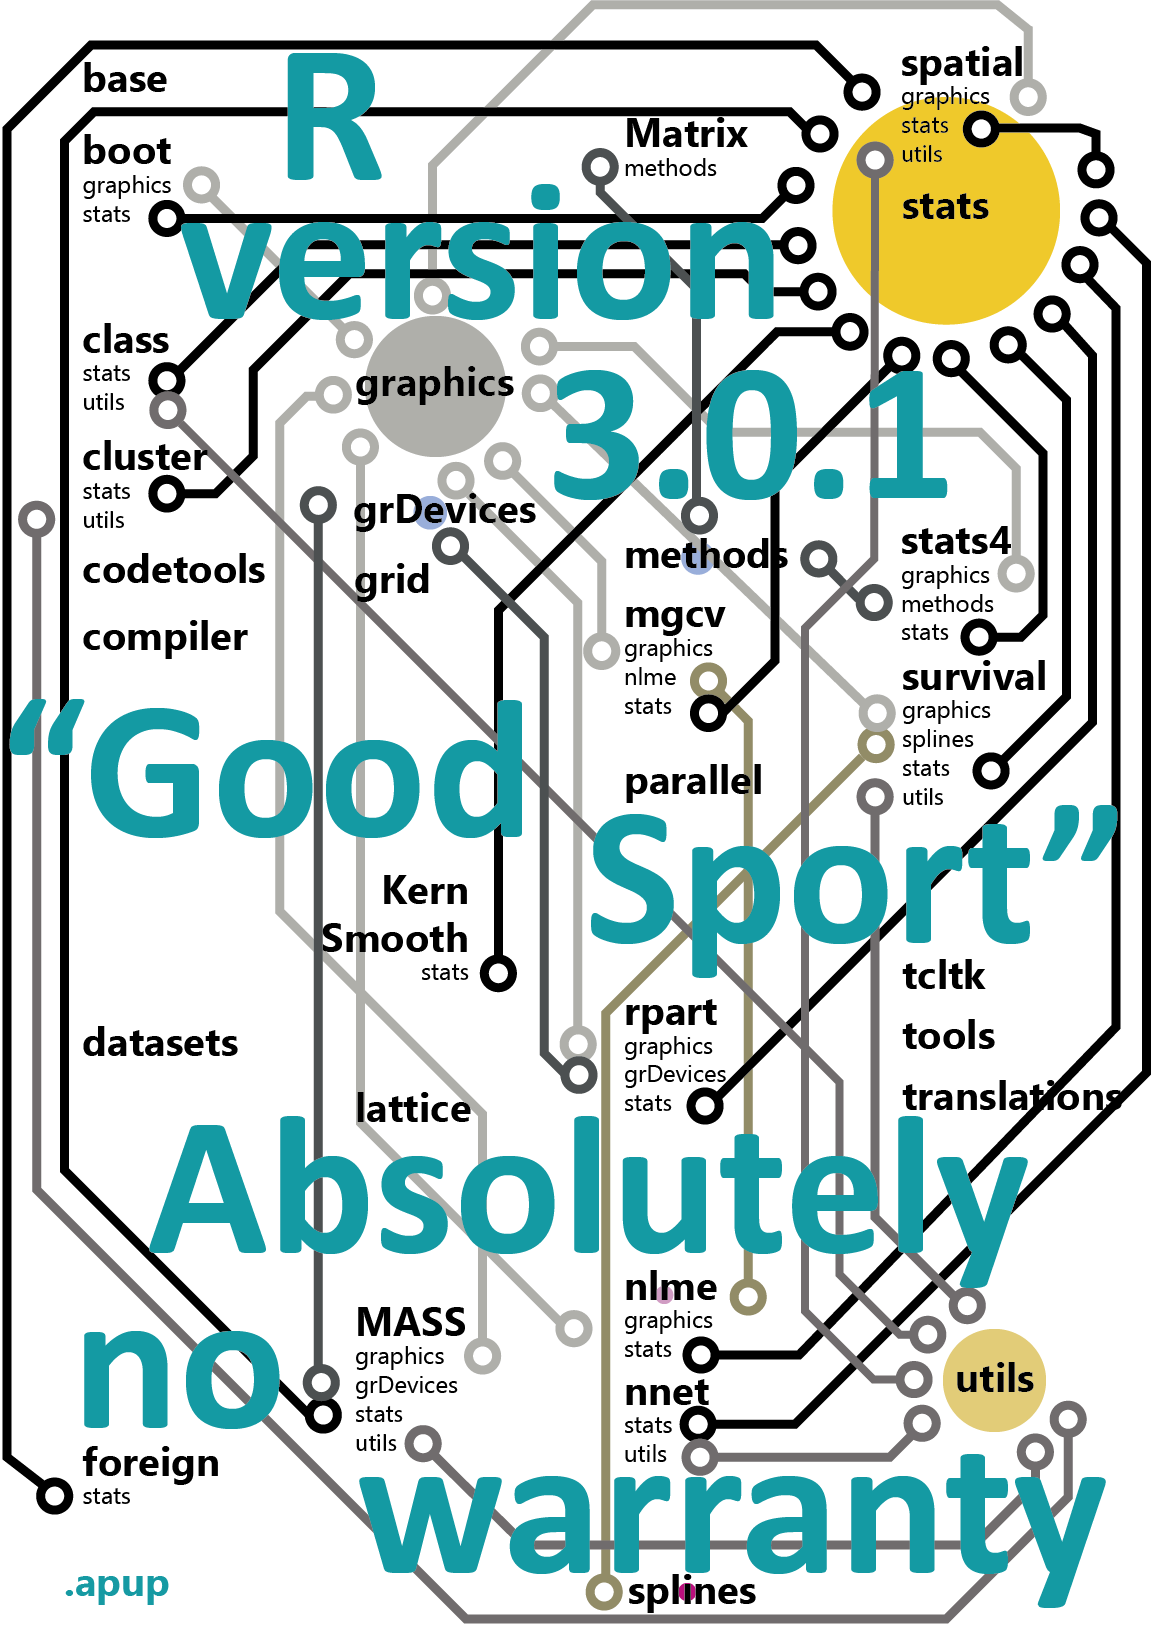
Following the Mash Creative tutorial I created an A2 base. For bottom layer I added grid, size able to be divided by four, and used it for displaying all package names. Under each package name I listed in smaller font all other packages that they were depended on. After calculating those depending package frequencies, I inserted circles, having size according to occurrence amount, under each package name. These circles would be representing the linkage dependency ratio towards other packages. The bigger the circle, the more there are other packages depending on it. Title texts were taken from the version name and number. Also the text for the lack of guarantee was an element I wanted to highlight: it attaches here some spice of the open-source attitude.
After initial settings and positioning, I realized what they mean when they refer that even grid is important guide – it should not be taken as the ultimately strict rule, but rather giving directional help. Even fitting all pieces to the canvas in the limits of the grid, the joint presentation did not just match; nor work out. Things looked randomly layered and in a bad way. Thus there was huge need to reposition a lot of package names, adjusting titles and so on. Giving up on conducting the alphabetical order made a difference and the layout started to look durable bit by bit. For finalizing the connections between packages and their dependencies, I combined them with circuit-board-inspired conductive tracks and connection pads. The final set of elements resembled something strange between a circuit board and a metro map.
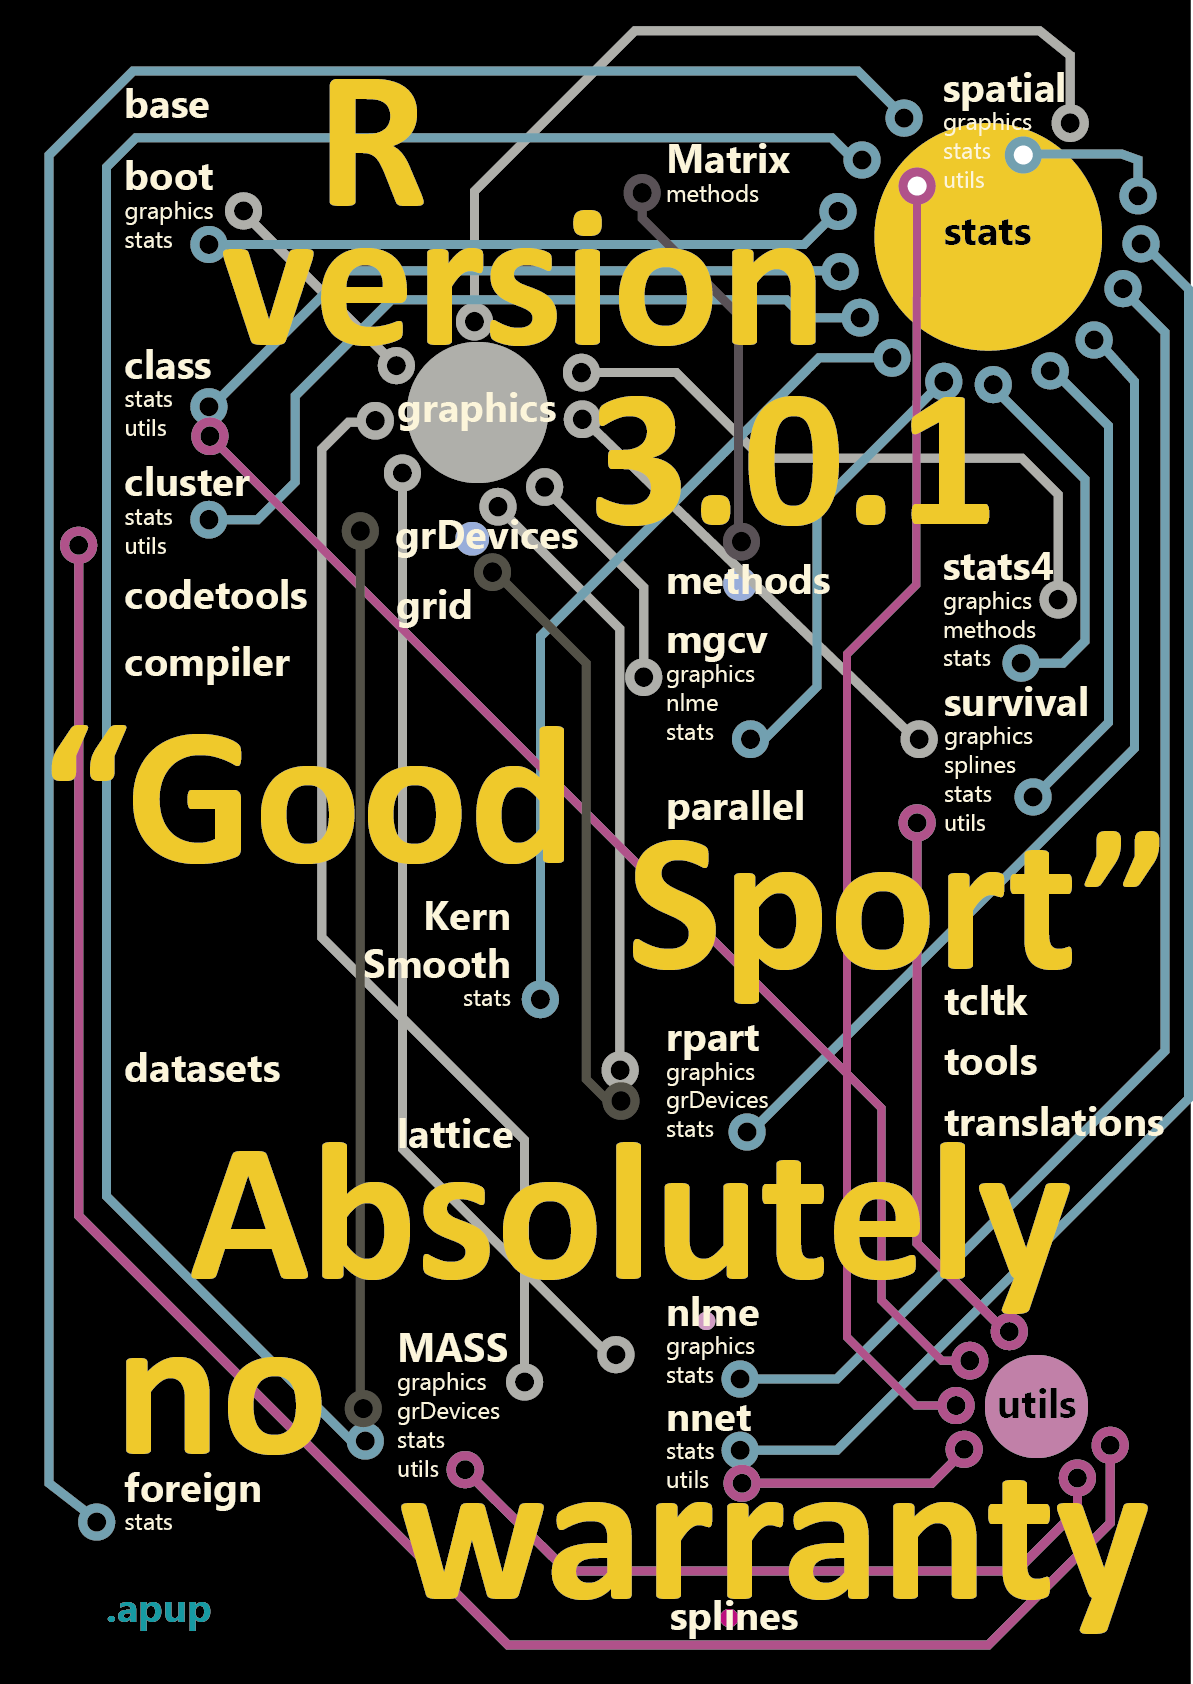
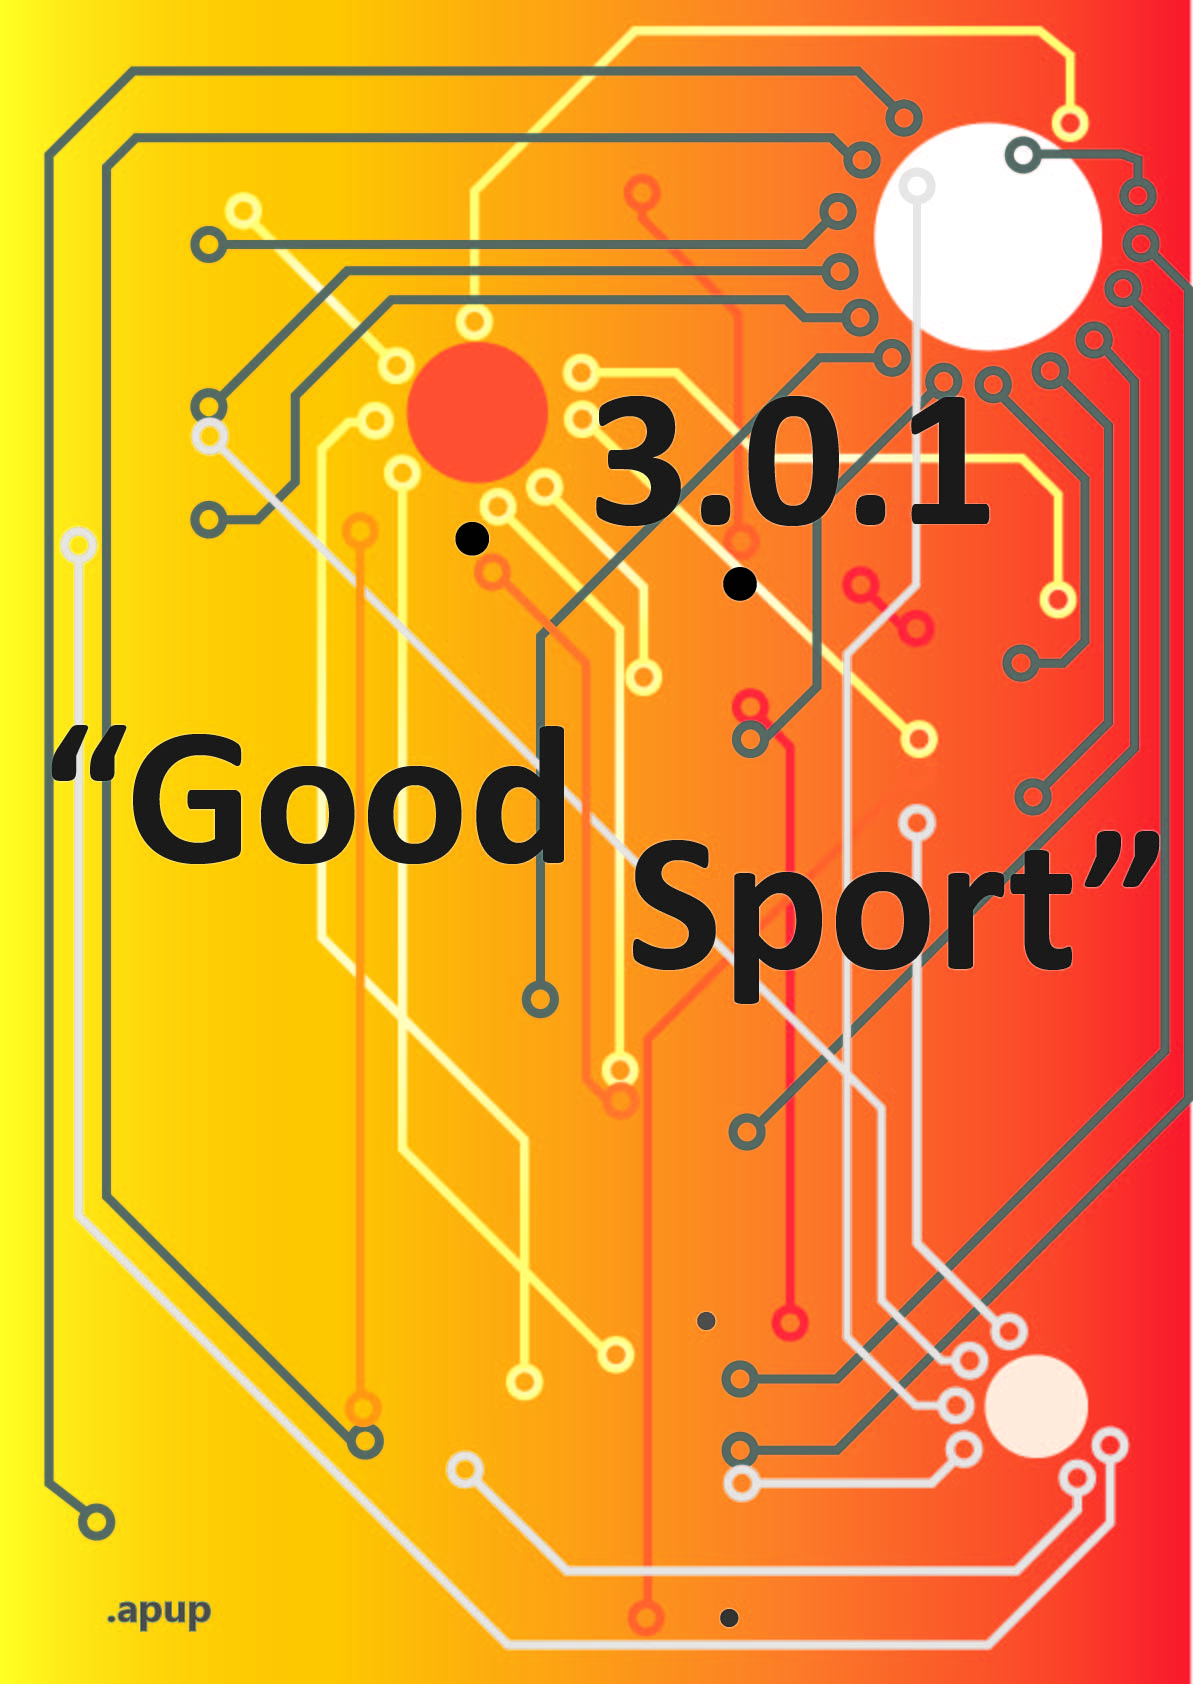
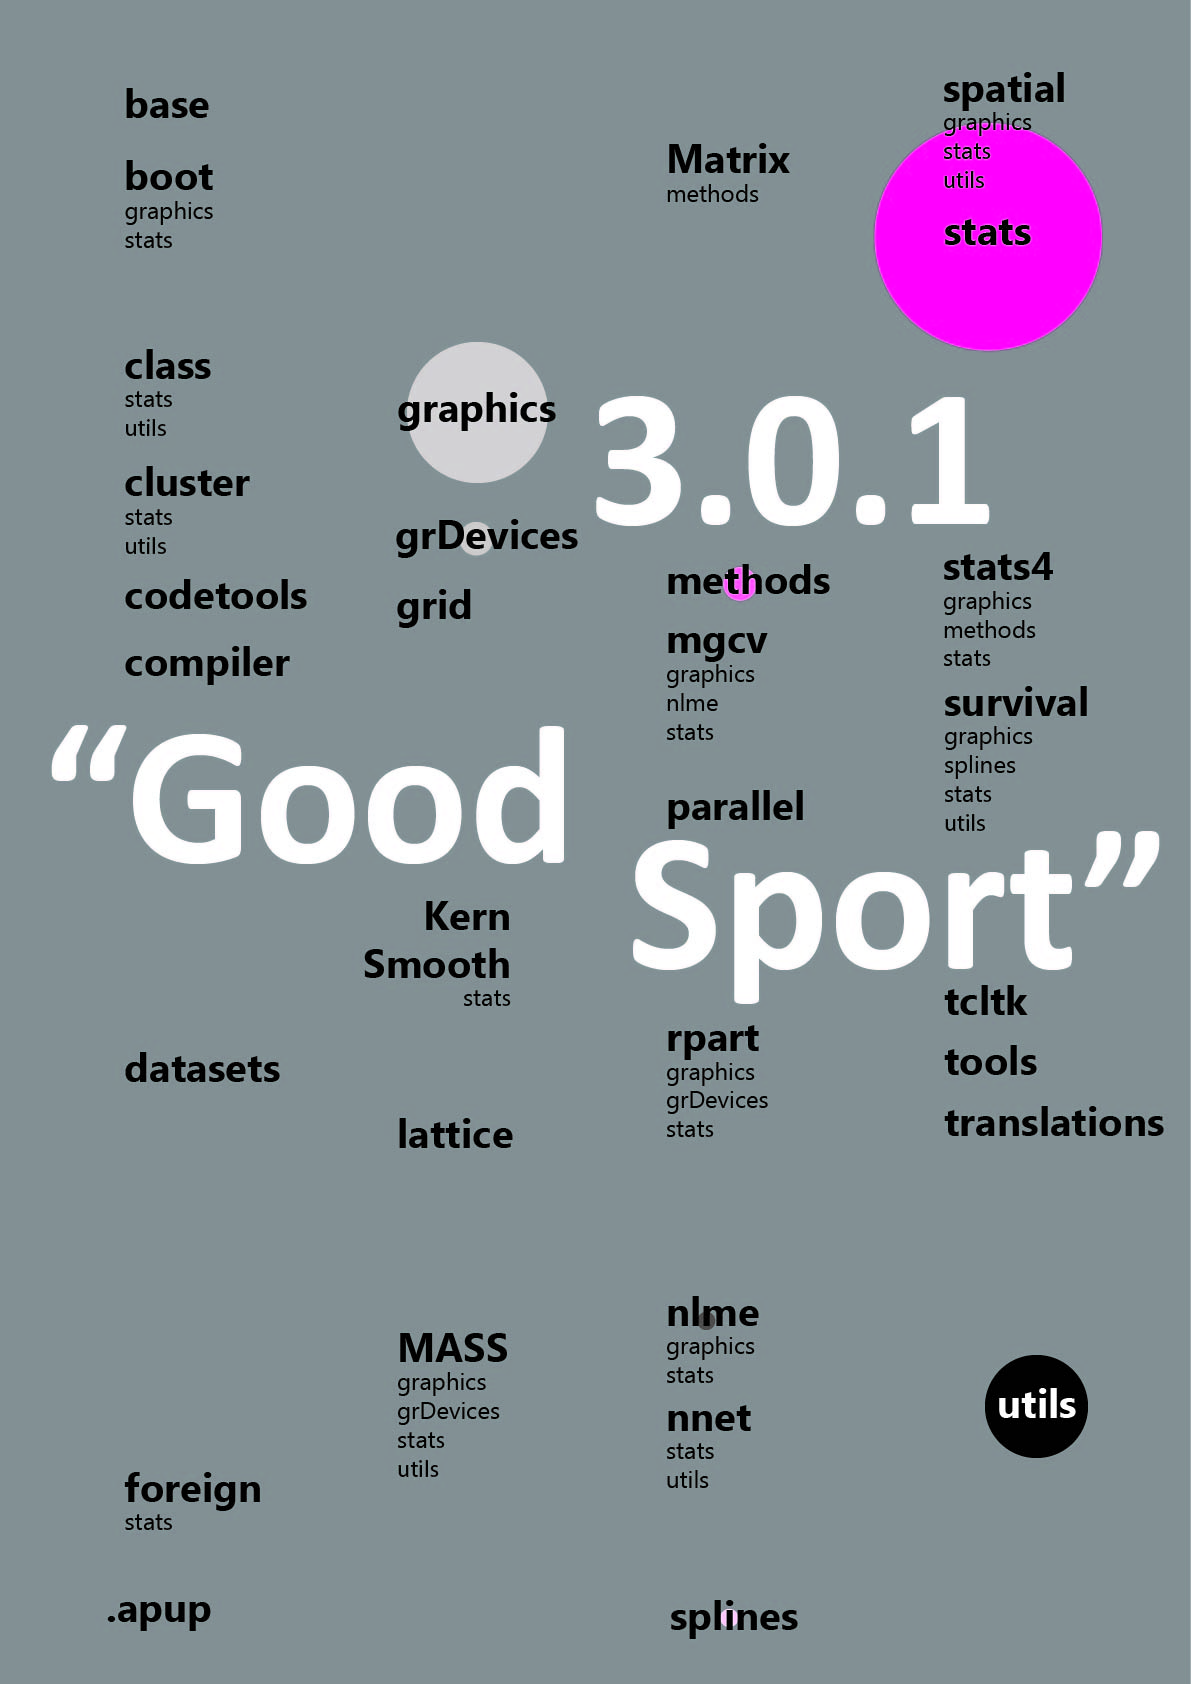
The colors were difficult as always. Yet using few color schemas I was able to produce different moods to the poster. 1st version offers teal, mustard and less than 50 shades of grey. It is neat and neutral edition. 2nd version has taken severe influence from liquorice allsorts and by having more contrast looks rather bold. For 3rd and 4th versions' decreased amount of elements brought simplicity, as removing either package names or connection paths from the posters. Playing with hues ended up giving them vivid pigmentation from orange to pink grapefruit with 3rd poster. The simplest version (4th) isn't that bad neither, embracing nothing but greyish-purple paints.
End result
As result stats, utils and graphics are packages which many other default packages depend on. Considering wild name conventions, at least these sound easy to comprehend. Should one assume, that as default, R is a tool for statistics, utilizing and graphics?
I also wonder whether the default packages have changed during the time a lot.
Summary:
I am R.
I got names from Peanuts – thus a red-haired creature is combined to me.
I have Absolutely No Warranty, so wear a pumpkin helmet...
∎